Demographics
Colorado Springs is rapidly changing in terms of demographics composition. Studying our population is one of the best ways we can understand our community. Explore this page to learn about who lives in the Pikes Peak Region!
Report summary:
Demographics
Demographics Summary
The Colorado Springs Metropolitan Statistical Area (MSA) is different than the United States in many ways and is rapidly changing in terms of demographic composition.
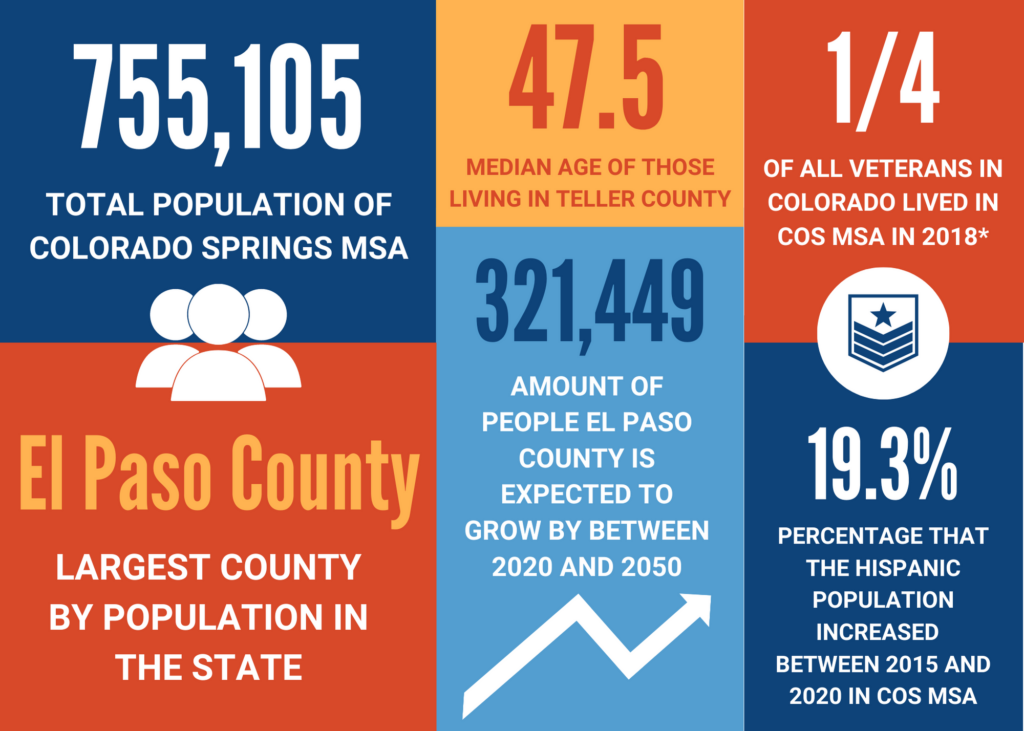
- El Paso County (730,395) and Teller County (24,710) combined comprise the Colorado Springs MSA, with a total population of 755,105.
- El Paso County is the largest county by population in the state. √
- In 2020, the City of Colorado Springs, a component of El Paso County, had a population of 478,961.
- Between 2010 and 2020 in the Colorado Springs MSA, population increased 17%, whereas the State of Colorado increased 14.8% and the overall U.S. population increased 7.4%.
- Between 2020 and 2050, El Paso County is projected to have an increase of approximately 321,449 additional people; Teller County is projected to have an increase of approximately 4,361 people.
- The median age in 2020 was 33.7 in El Paso County and 47.5 in Teller County, while it was 37.3 in Colorado and 38.4 (2019 projection) in the U.S.
- The two largest age cohorts in our region (El Paso and Teller Counties combined) using 2019 estimates were 0 to 17 and 25 to 44 years old.
- The Colorado Springs MSA age group of 65 and over increased 23.43% from 2015 to 2020, with differences between El Paso, up 22.98% and Teller, up 31.30%.
- The Colorado Springs MSA Hispanic population increased 19.3% between 2015 and 2020, up three percentage points from the previous five years, while White non-Hispanics increased 20.5% during that same time span.
- For people aged 16 and over who are in the labor force, El Paso County has a higher percentage (5.2%) in the U.S. Armed Forces than the comparison counties (American Community Survey 2019).
- The Colorado Springs MSA was home to a quarter of all veterans living in Colorado in 2018.
* Most recent data available: https://www.va.gov/vetdata/veteran_population.asp
Source: 2020 census data: https://www.census.gov/quickfacts/CO
Key Indicators
Click on an indicator to learn more about it! Be sure to use the infographics and additional resources for the full experience.
Report summary:
Demographics
Demographics Summary
The Colorado Springs Metropolitan Statistical Area (MSA) is different than the United States in many ways and is rapidly changing in terms of demographic composition.
- El Paso County (730,395) and Teller County (24,710) combined comprise the Colorado Springs MSA, with a total population of 755,105.
- El Paso County is the largest county by population in the state. √
- In 2020, the City of Colorado Springs, a component of El Paso County, had a population of 478,961.
- Between 2010 and 2020 in the Colorado Springs MSA, population increased 17%, whereas the State of Colorado increased 14.8% and the overall U.S. population increased 7.4%.
- Between 2020 and 2050, El Paso County is projected to have an increase of approximately 321,449 additional people; Teller County is projected to have an increase of approximately 4,361 people.
- The median age in 2020 was 33.7 in El Paso County and 47.5 in Teller County, while it was 37.3 in Colorado and 38.4 (2019 projection) in the U.S.
- The two largest age cohorts in our region (El Paso and Teller Counties combined) using 2019 estimates were 0 to 17 and 25 to 44 years old.
- The Colorado Springs MSA age group of 65 and over increased 23.43% from 2015 to 2020, with differences between El Paso, up 22.98% and Teller, up 31.30%.
- The Colorado Springs MSA Hispanic population increased 19.3% between 2015 and 2020, up three percentage points from the previous five years, while White non-Hispanics increased 20.5% during that same time span.
- For people aged 16 and over who are in the labor force, El Paso County has a higher percentage (5.2%) in the U.S. Armed Forces than the comparison counties (American Community Survey 2019).
- The Colorado Springs MSA was home to a quarter of all veterans living in Colorado in 2018.

* Most recent data available: https://www.va.gov/vetdata/veteran_population.asp
Source: 2020 census data: https://www.census.gov/quickfacts/CO
Colorado Springs MSA Population
Colorado was one of eight states in the top 10 for numeric and percentage growth between 2018 and 2019 (Johnson, 2019). In 2020, Colorado’s population was 5,773,714, an increase of 14,978 residents from the previous year, which was based on forecasts from the 2010 census data (military personnel are included in population numbers).
Why Is This Important?
Population growth of any kind has a significant impact upon quality of life. It influences the labor market, education and other infrastructure needs, the tax base, future planning, and conservation of resources, as well as the health of the economy in general. Planning for growth is important for quality of life, but also to pursue economically and socially sustainable policies.
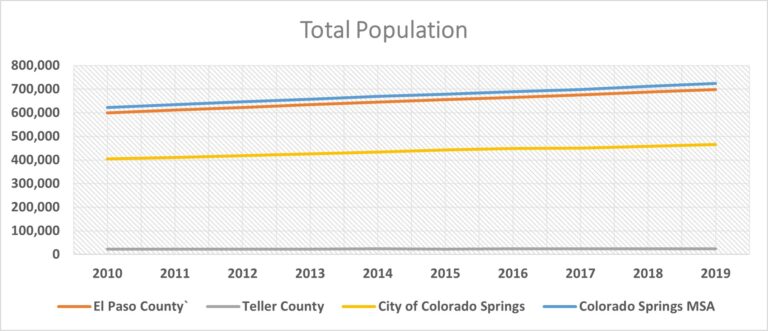
El Paso County (15.8%) has grown slightly faster than Colorado (14.5%) since 2010, with Teller County (8.7%) outpacing the overall increase in the U.S. (6.3%). According to the State Demography Office, El Paso and Teller Counties hit their peak population increases between 2015 and 2020 and will begin to have smaller increases, ranging from 0.4% to 1.5% over five-year increments.
Population by Race
Population by Race
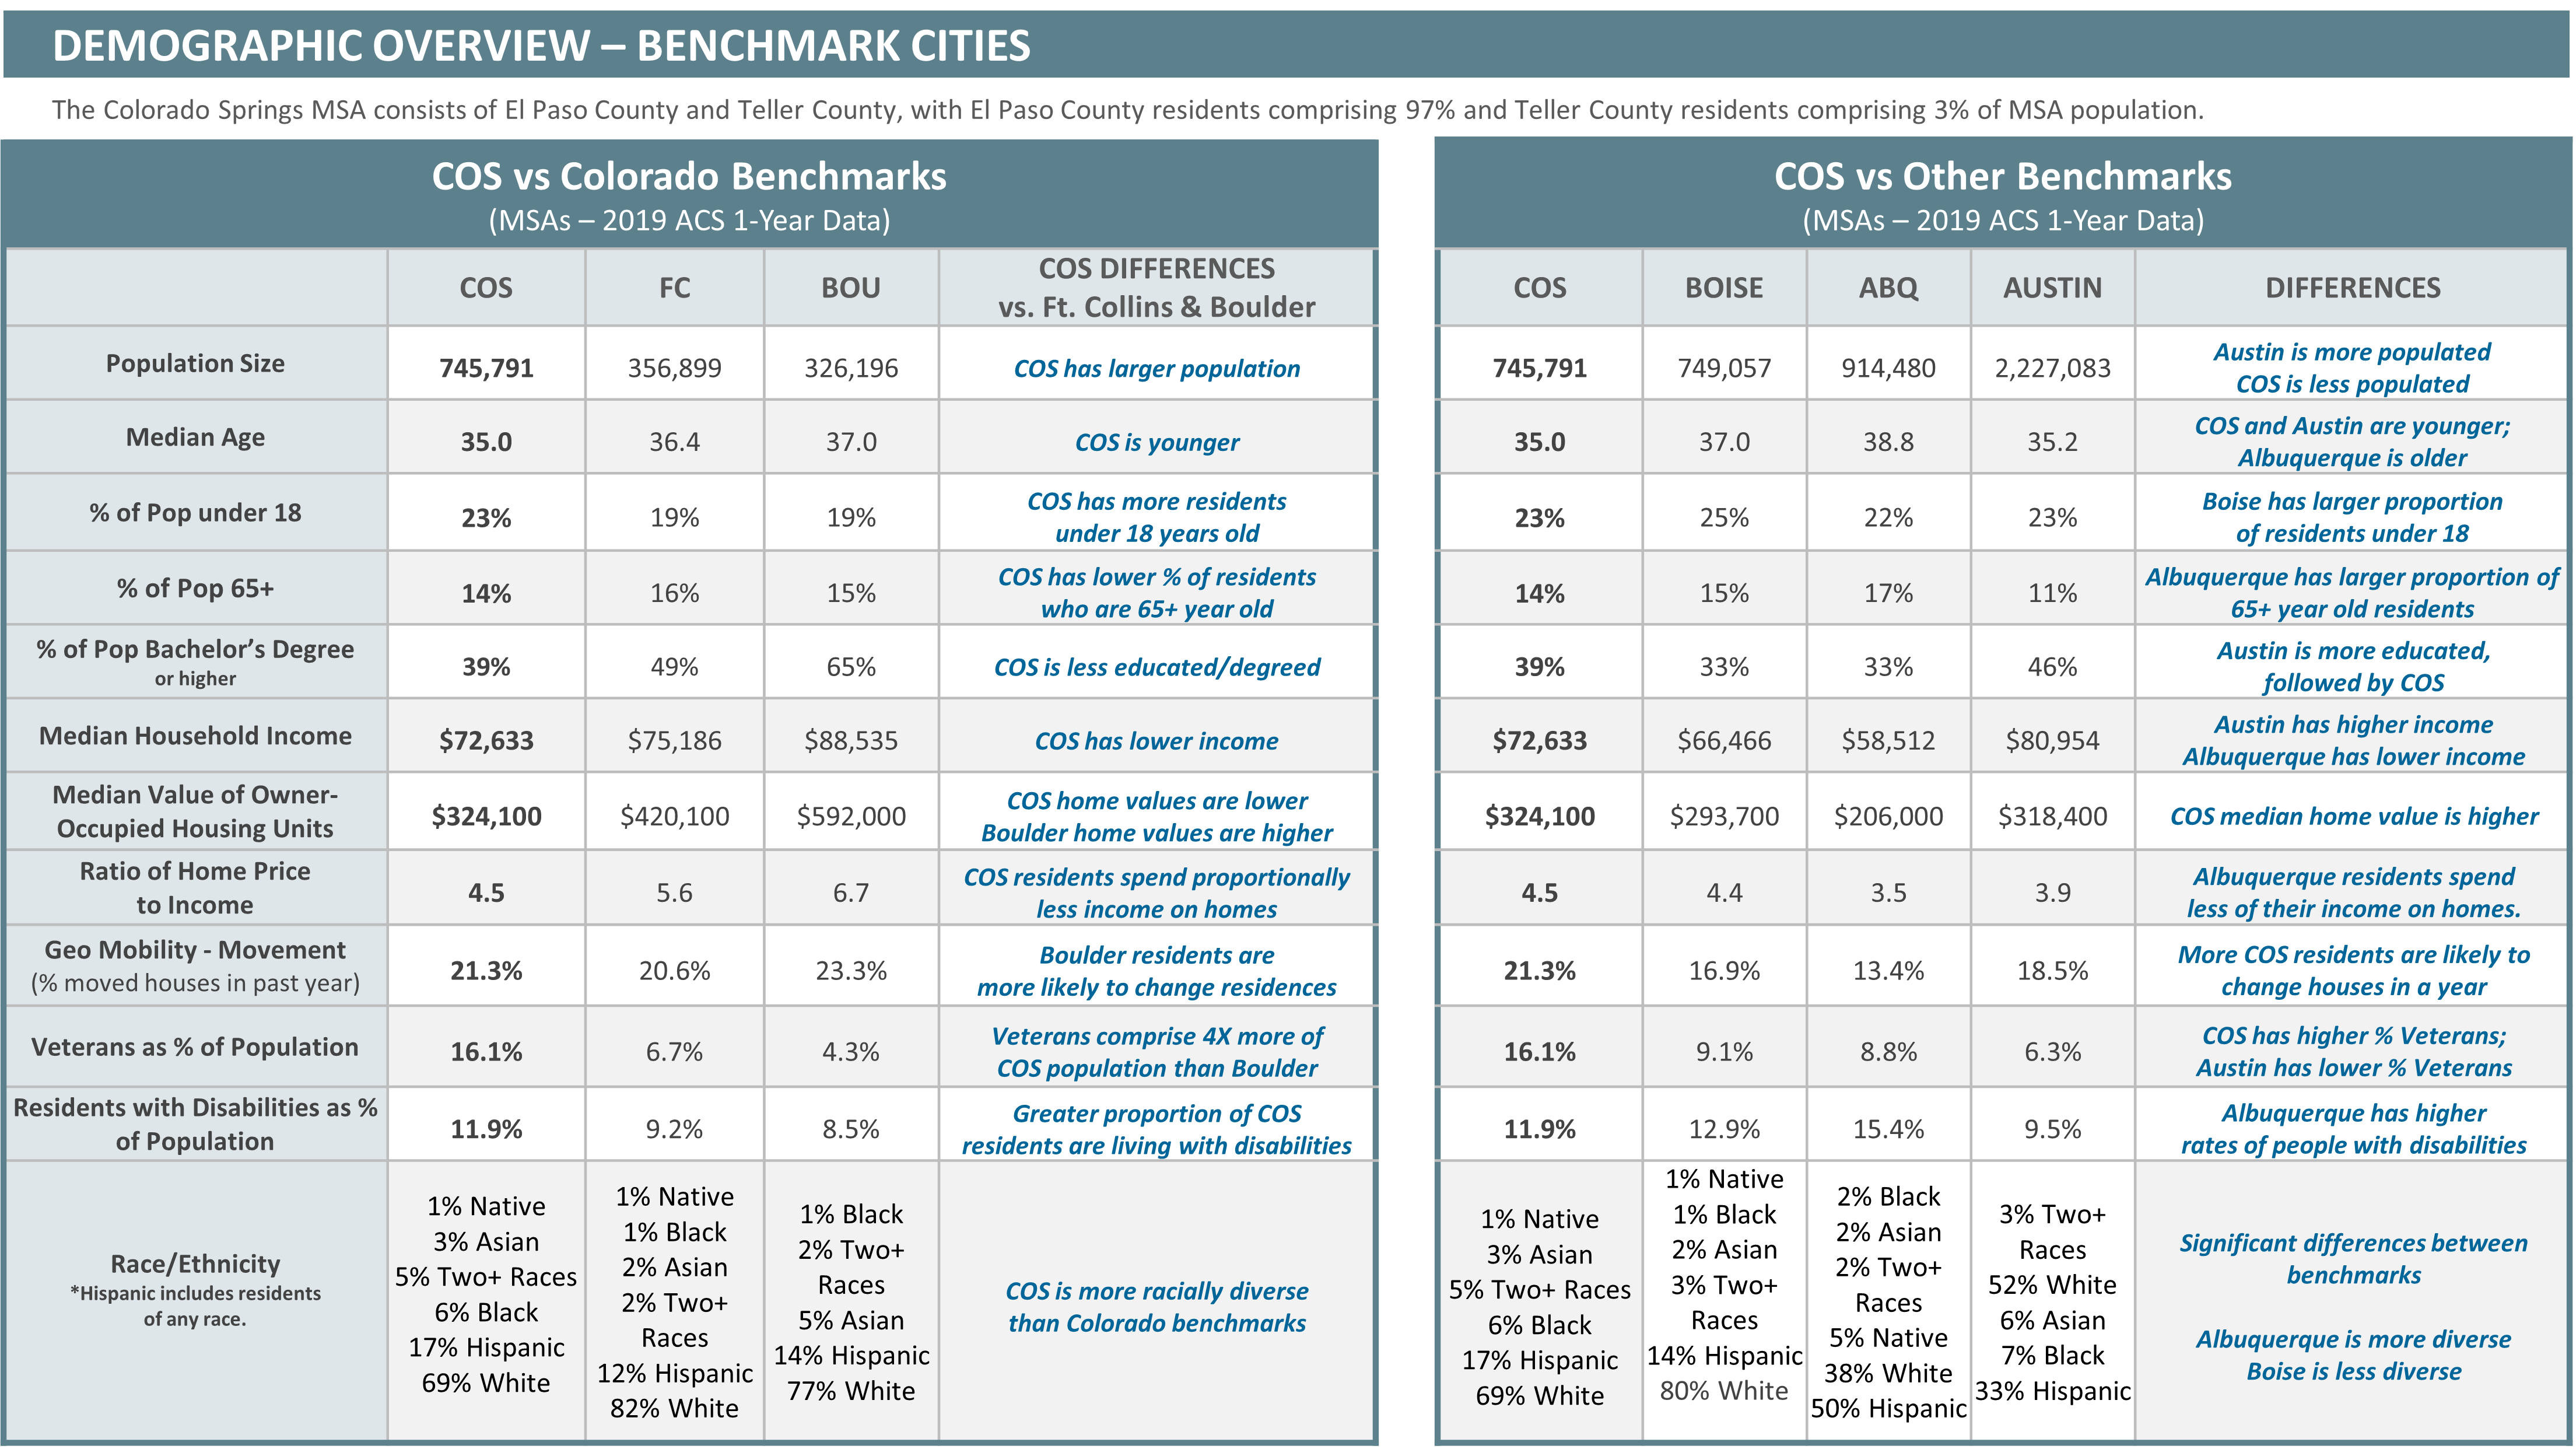
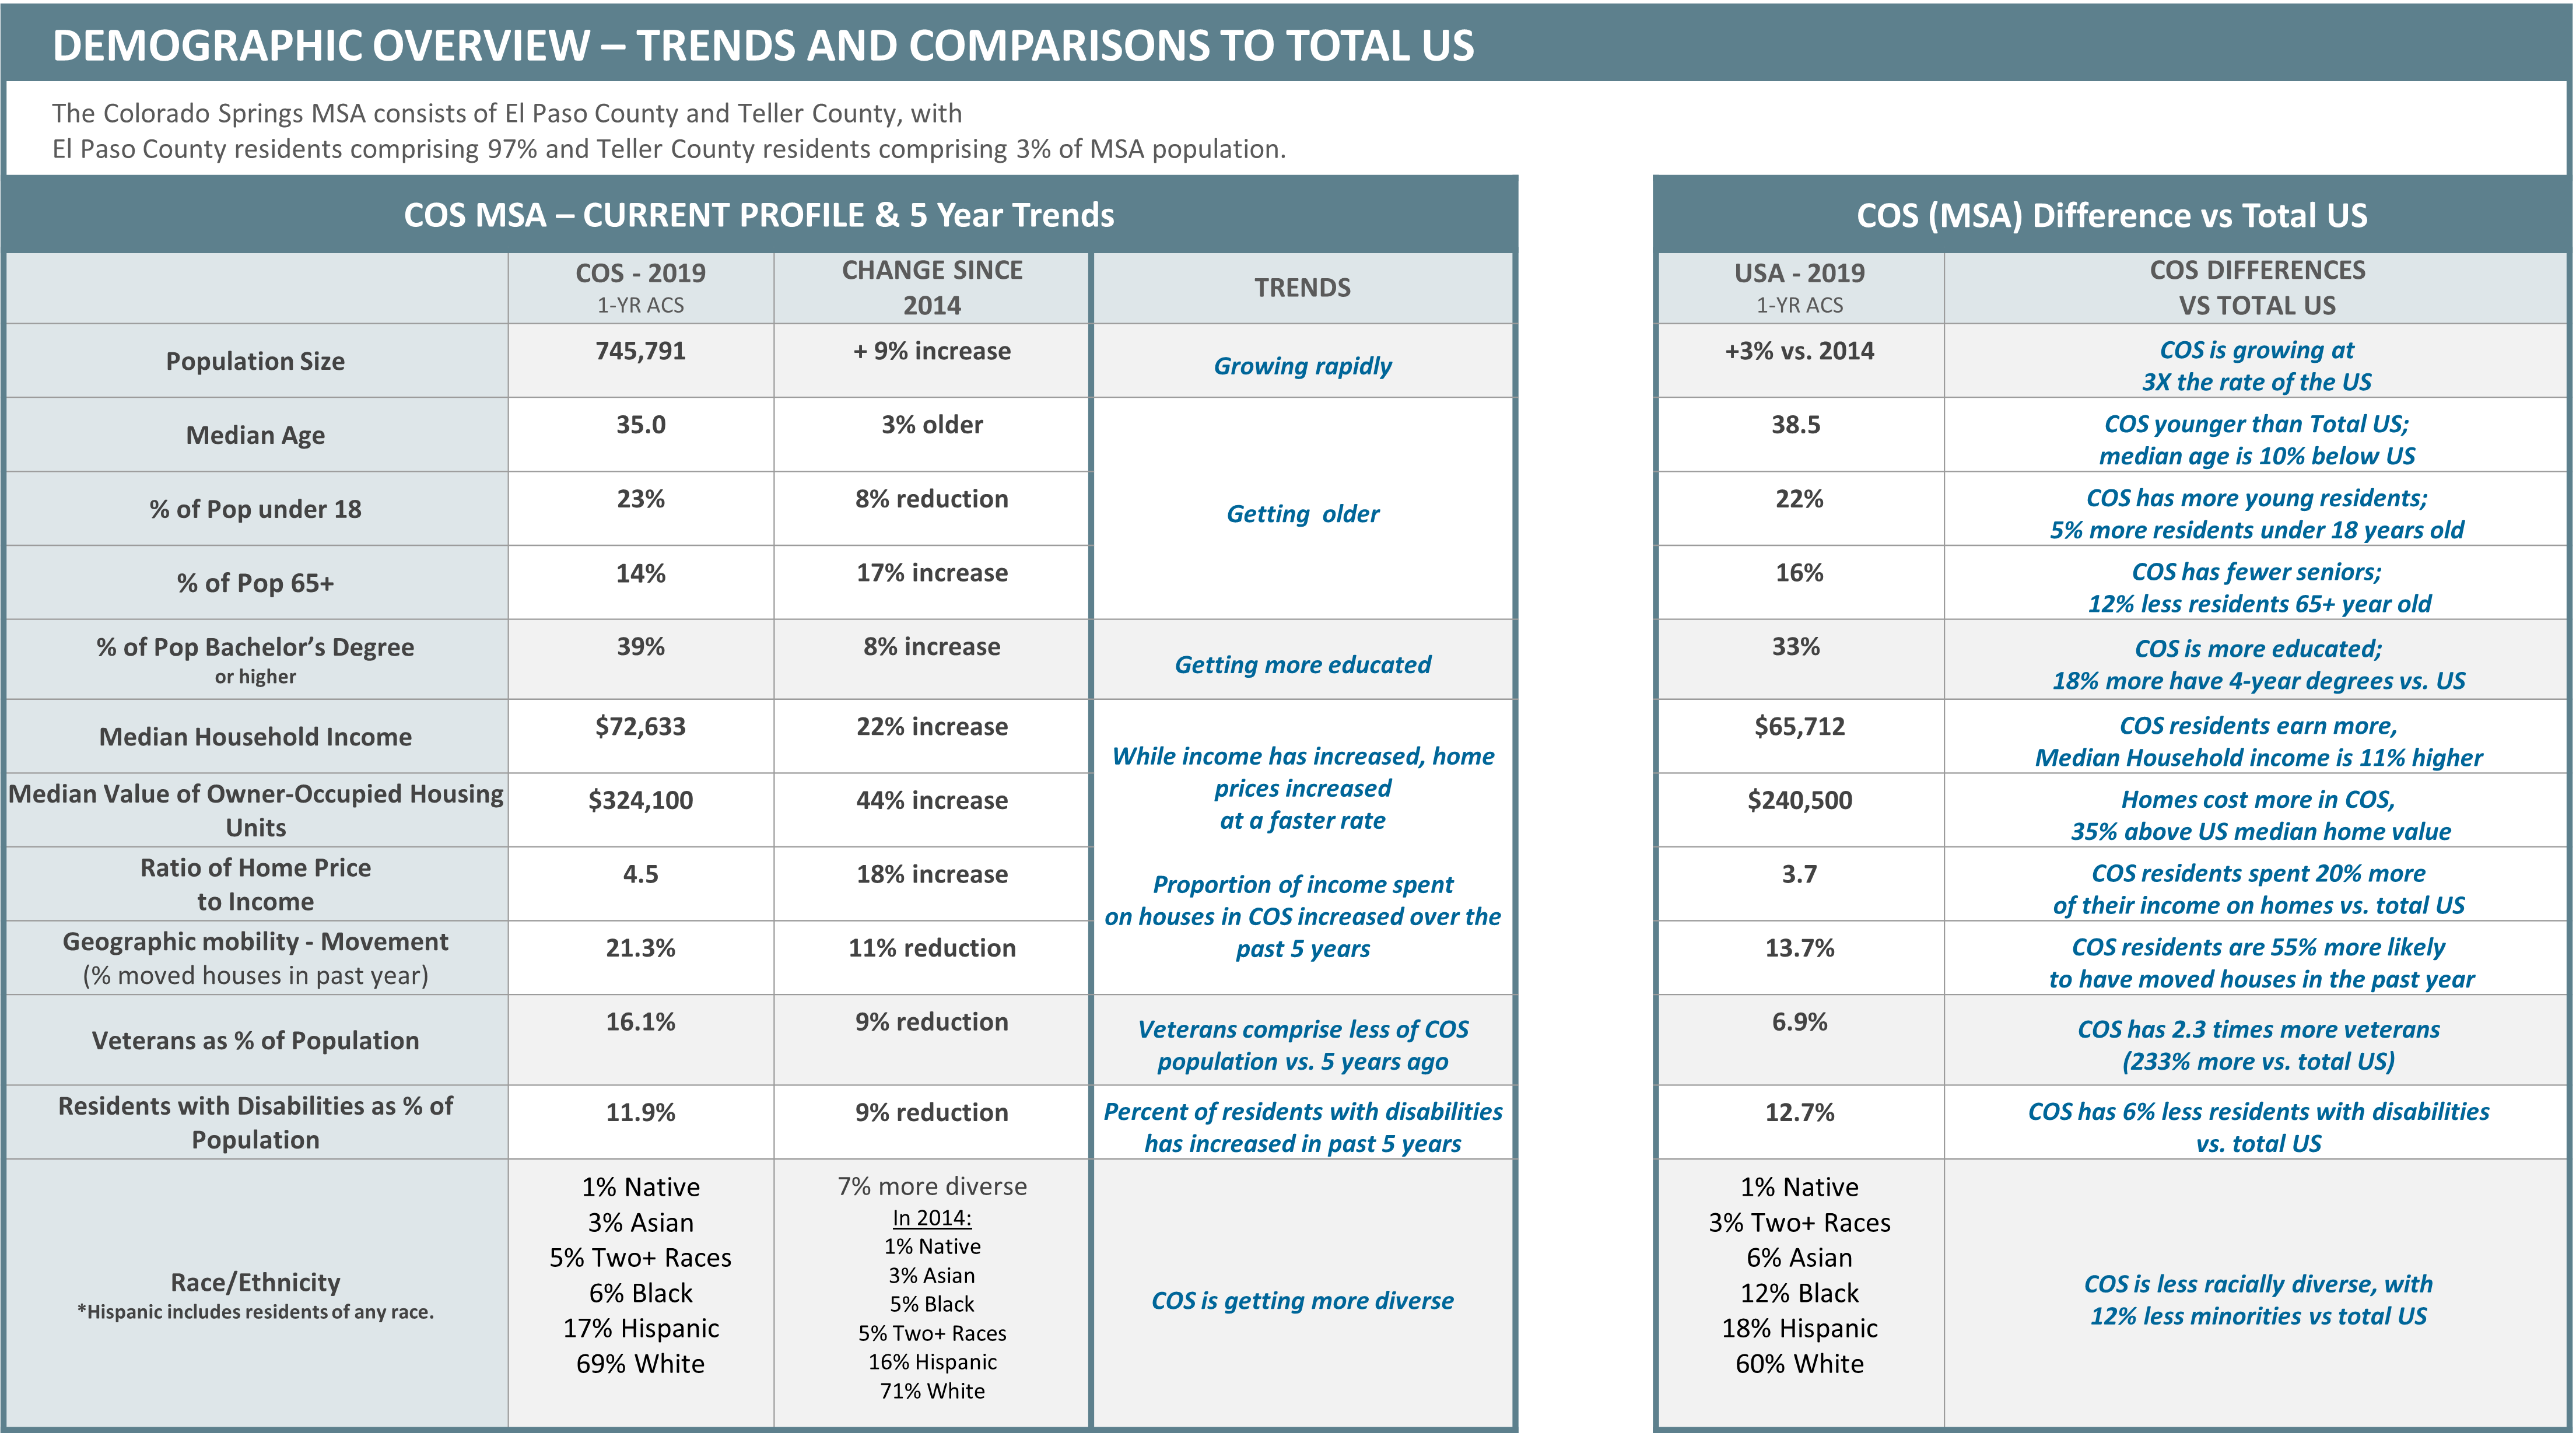
According to the State Demography Office, our MSA is expected to see a significant increase in both the Hispanic and Asian populations by 2050 and a significant decrease (approximately 13.5%) in the White population. In 2019, compared to the United States, the Colorado Springs MSA had a slightly higher percentage of people who identify as two or more races, about the same percentage of Hispanic or Latinos and American Indians, fewer Black or African Americans, and more White people.
NOTE: According to the Department of Local Affairs, race and ethnicity in the U.S. Census are self-identification data items in which residents choose the race or races with which they most closely identify, indicating whether they are of Hispanic or Latino ethnicity. Race and ethnicity are considered separate and distinct identities.
Non-Racial Demographics
Non-Racial Demographics
Community diversity does not only include those who identify as different races or ethnicities. Diversity means differences in languages spoken, immigration status, religion, beliefs, backgrounds, sexual orientation, gender, age, and social class. When the Colorado Springs MSA is compared to the U.S., Colorado Springs has a significantly higher percentage of veterans. There are hundreds of variances in individuals that demonstrate the array of peoples within a community. This chart provides a snapshot of some of the area’s diverse characteristics.
Household Composition
Household Composition
Proportions of household composition (e.g., married, single parent, nonfamily household) have not changed significantly in the Colorado Springs MSA since 2009. Recognizing the variety among the MSA’s household composition guides the community in considering ways to support the well-being of its residents. According to Social Explorer, there was an increase (2.6%) of households with no people under 18 years in the Colorado Springs MSA. However, much of that change has taken place in Teller County, where just over 80% of the households recorded no people under 18.
Components of Change
Components of Change
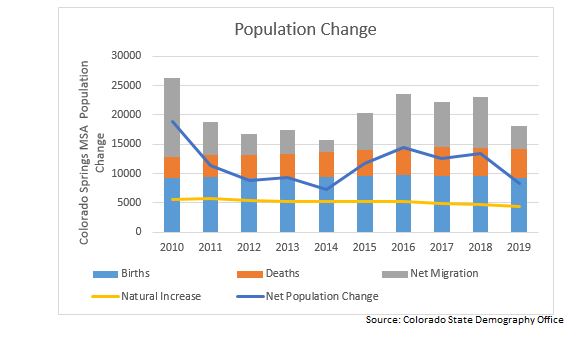
Population change comes from natural increase (births minus deaths) and from net migration (people moving in minus those moving out of a region). The sum of these components is the change in population. Colorado varies considerably in growth trends, with some rural counties experiencing both out-migration and more deaths than births. The Colorado Springs MSA, located on the fast-growing Front Range, reflects the popularity of the state for employers and residents. From 2017-2018, El Paso County’s population experienced the largest growth in Colorado for a 2nd year in a row, increasing by 12,854. While the local natural increase has remained relatively steady over the last several years, net migration has had a great deal of fluctuation, with a notable decrease in the state (34%) from 2019 to 2020 due to the pandemic. While Colorado and the Colorado Springs MSA will continue to grow, the rate of growth is expected to decline over the next decade.
Population Features and Trends
Population Trends
Overall, our population is expected to age and to become more diverse over the course of the next 5 years according to the State Demography Office. By 2025, the population of those aged 65 and over is projected to increase by 3.5% in the MSA. There has been some growth in the 30–49-year-old group, which is favorable given that those are prime working ages. Increases will also be seen in the ages leading up to that cohort (ages 0 to 29), while there are projected decreases for the pre-retirement cohort (ages 50 to 64). The forecast for population growth in the United States is 0.5% and the state of Colorado at 0.9%, with El Paso County at 1.6% (Colorado Office of State Planning).
The Peak Progress (QLI) Report is a community effort to look at and evaluate different components of quality of life in the Pikes Peak Region. This project convenes volunteers, community members, and leaders from across the region (Vision Councils) to gather and evaluate data and create goals (referred to as “priority areas”) in various categories.
This report originated in 2007 after Howard Brooks and Jerry Smith recognized the need for benchmarking information and gathered the necessary community support and resources to publish the first edition. The 2019/2020 report seeks to move the report forward by not only focusing on indicators, but also looking for ways to take these findings and create actionable change and improve the quality of life in the Pikes Peak Region. To do this, we followed the original process of creating benchmarks by comparing the Pikes Peak Region to other regions in order to see how we are doing compared to other places in the United States, as well as looking at data over time.
This report is for anyone from a general citizen to an elected representative. Based on the foundation of community groups, networks, and resources that were assembled to develop it, this highly beneficial tool provides reliable and easy to understand data with the potential and proposed steps for actionable change.
Demographics Test

Demographics Test

